NIST has joined the Learning Analytics Collaborative (LAC) where we work together on devloping a tool to visualize data and try to learn from each other on how to use learning data in order to improve student learning.
The data can be used for individual student differentiation, class by class comparisons, longitudinal study, and for decisions about entire programmes.
Data Use at NIST
The LAC has produced the LAC Playbook – A Guide for Building Cultures of Data Use.
Accessing the Learning Analytics System
There are two ways to access the LAC system. Click Tab 1 or Tab 2 below.
- 1. Login to Entire LAC System
- 2. View VC Query (My Students - Learning Analytics)
The link to the LAC tool is in Veracross under Systems menu, then Learning Analytics. Else, you can click this link from this page https://asia.analyticscollaborative.org/nist/login. All academic staff have access to this system. There are many different aspects of this system. We are in the process of migrating to a new Learning Analytics platform. The link will change to this: https://asia.linchpin-analytics.com/nist. The username is the first part of your email address and password is your NIST password (e.g. If your email is abcd@nist.ac.th, your username is abcd).

We have made the "baseball card" (student data profile) page of the Learning Analytics system show up inside of Veracross inside of a query called My Students - Learning Analytics. Here is a video guide for using this query. You can see ISA, MAP, Assessments, attendance, report grades, assessment scores, and ECA involvement for all enrolled years for each student.
- Please go to the Learning Analytics (LAC) system and ensure that you can login.
- Open the My Students – Learning Analytics query and be sure that you can see your students.
- Pop-out the LAC into a new tab.
Interpreting the Student Data Profile
There are many types of data in the LAC system. Here are some images to help you interpret what you see in the different components of the student profile.
ISA Assessment
These are all results for the child of the International Schools Assessment by Acer.

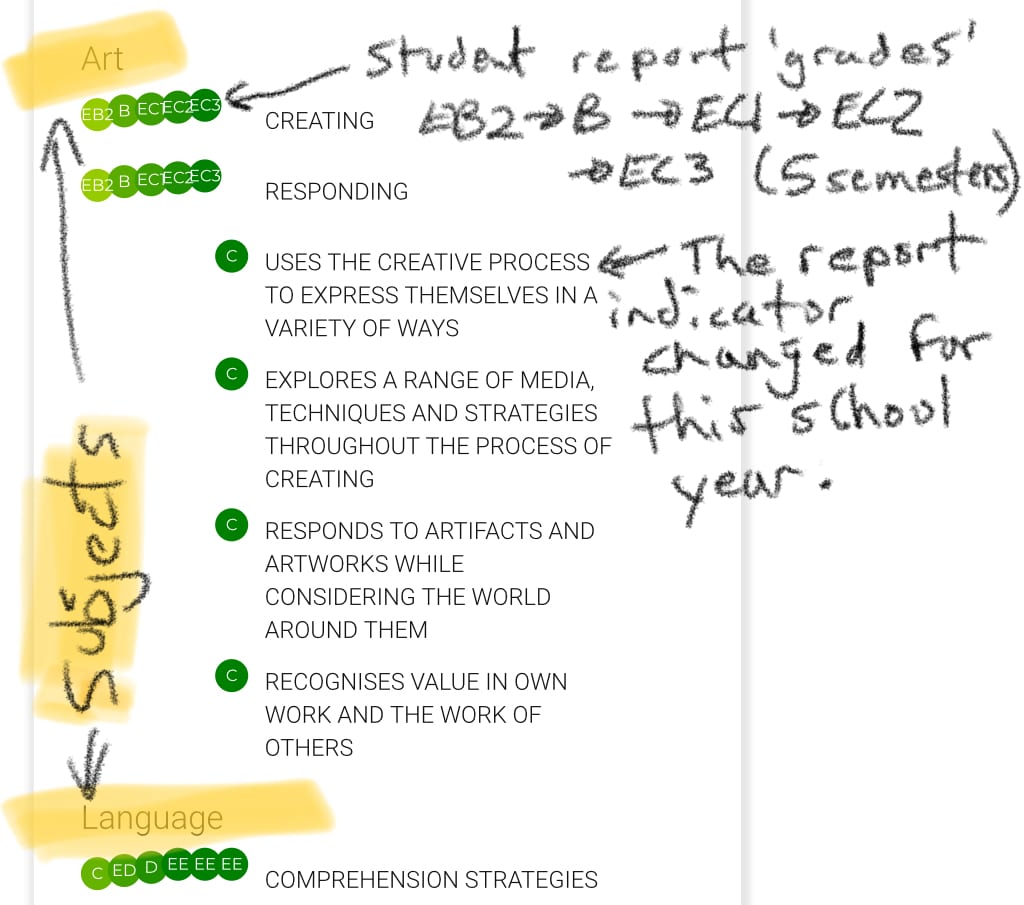
Standards-based Grades
These are elementary school report card grades for each indicator grouped by subject.
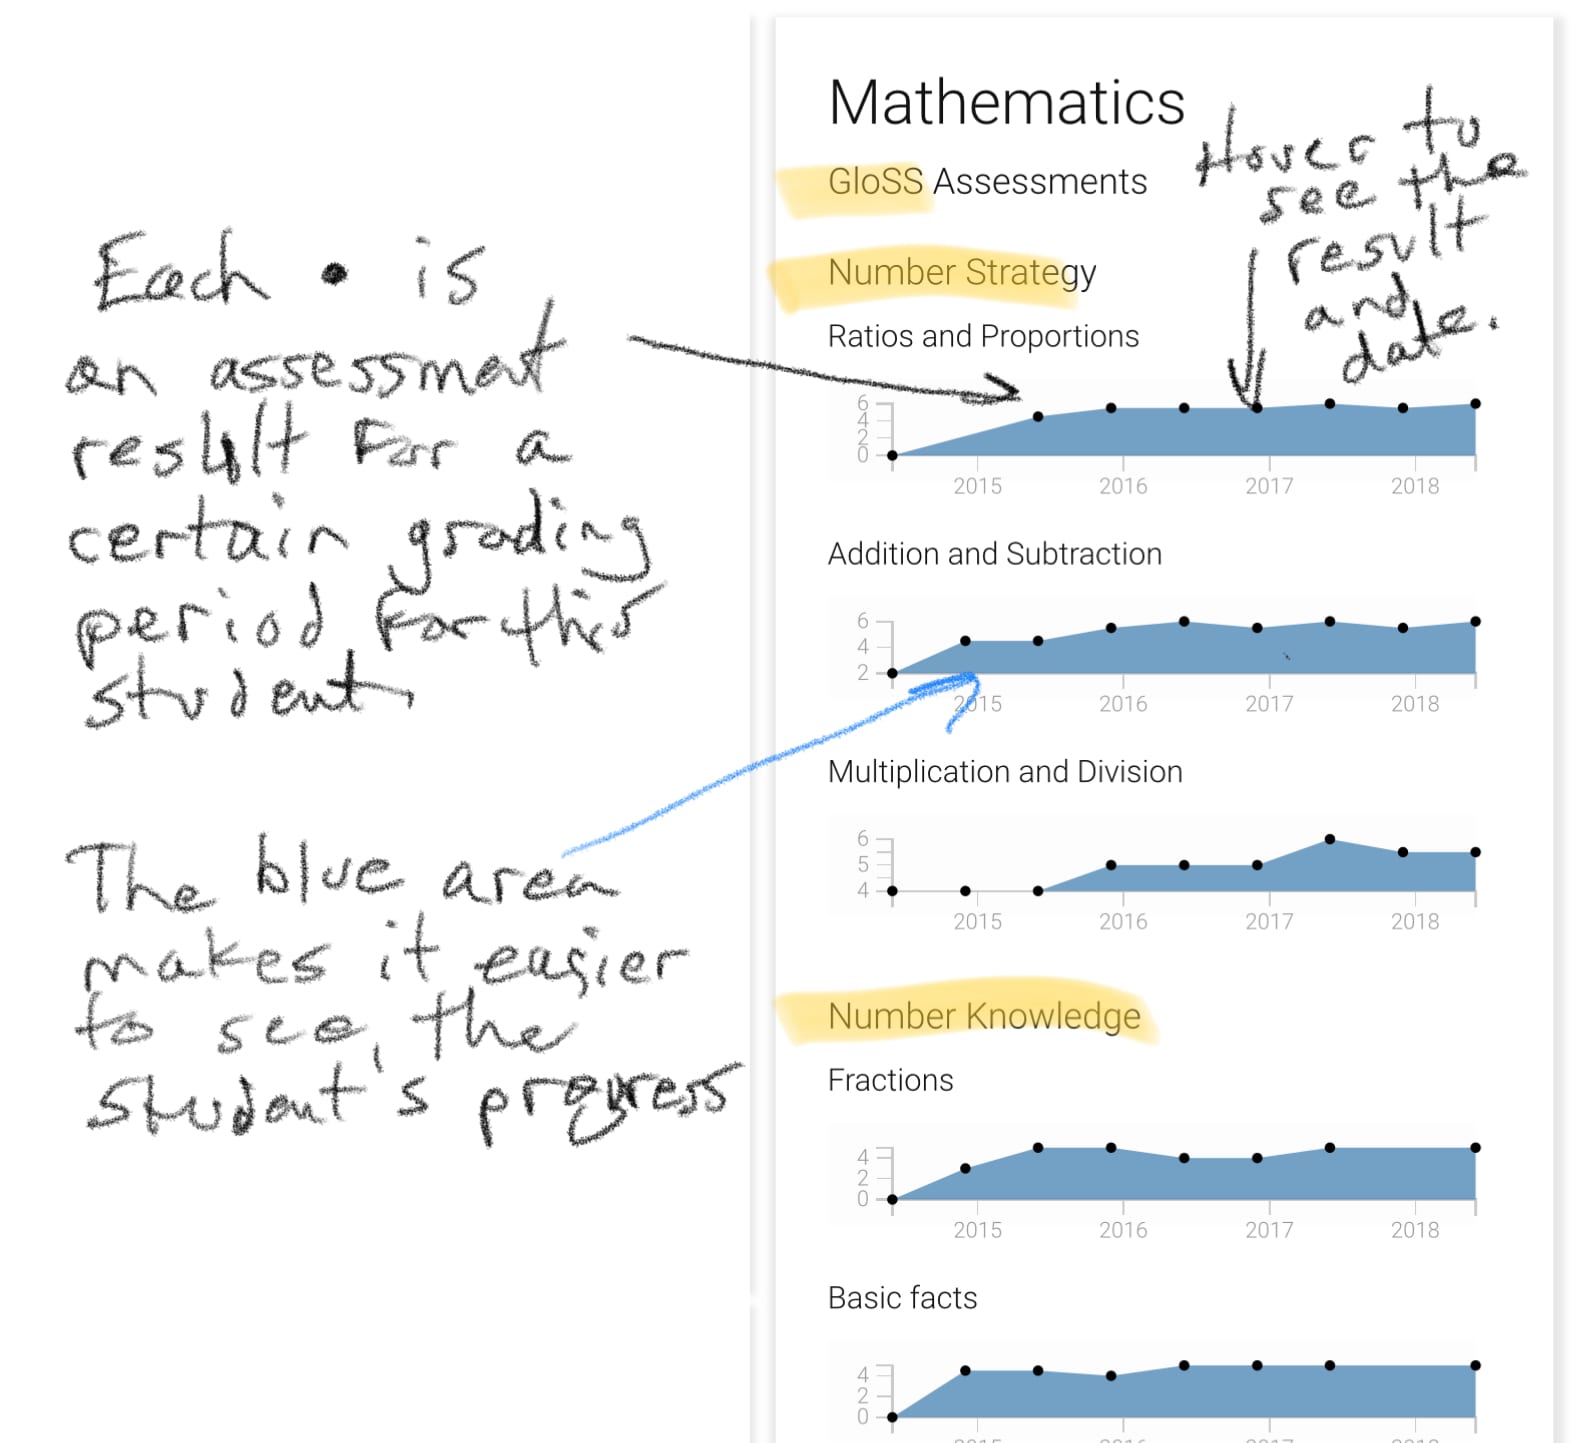
GLOSS & JAM Mathematics Assessments
Elementary mathematics assessments are put in twice per year in Years 1 to 6.
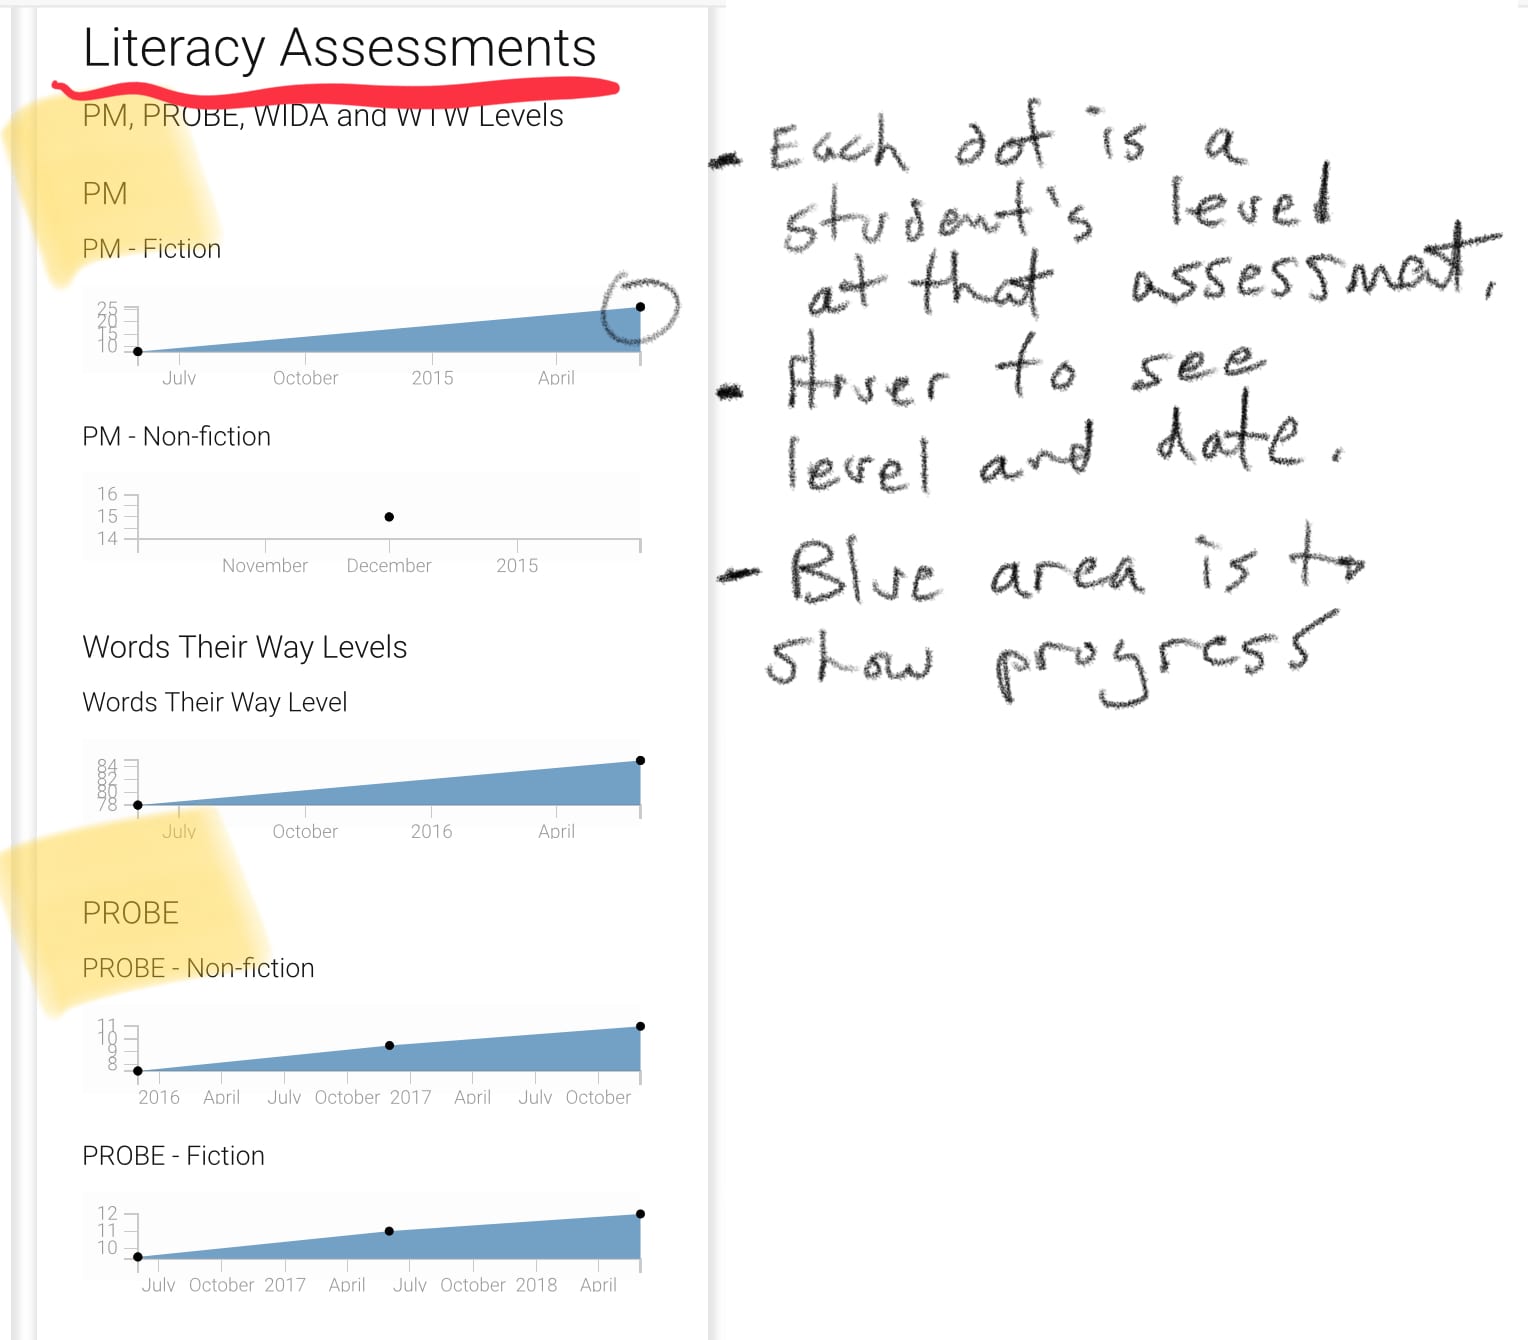
Literacy Assessments (PM, PROBE, WIDA, WTW)
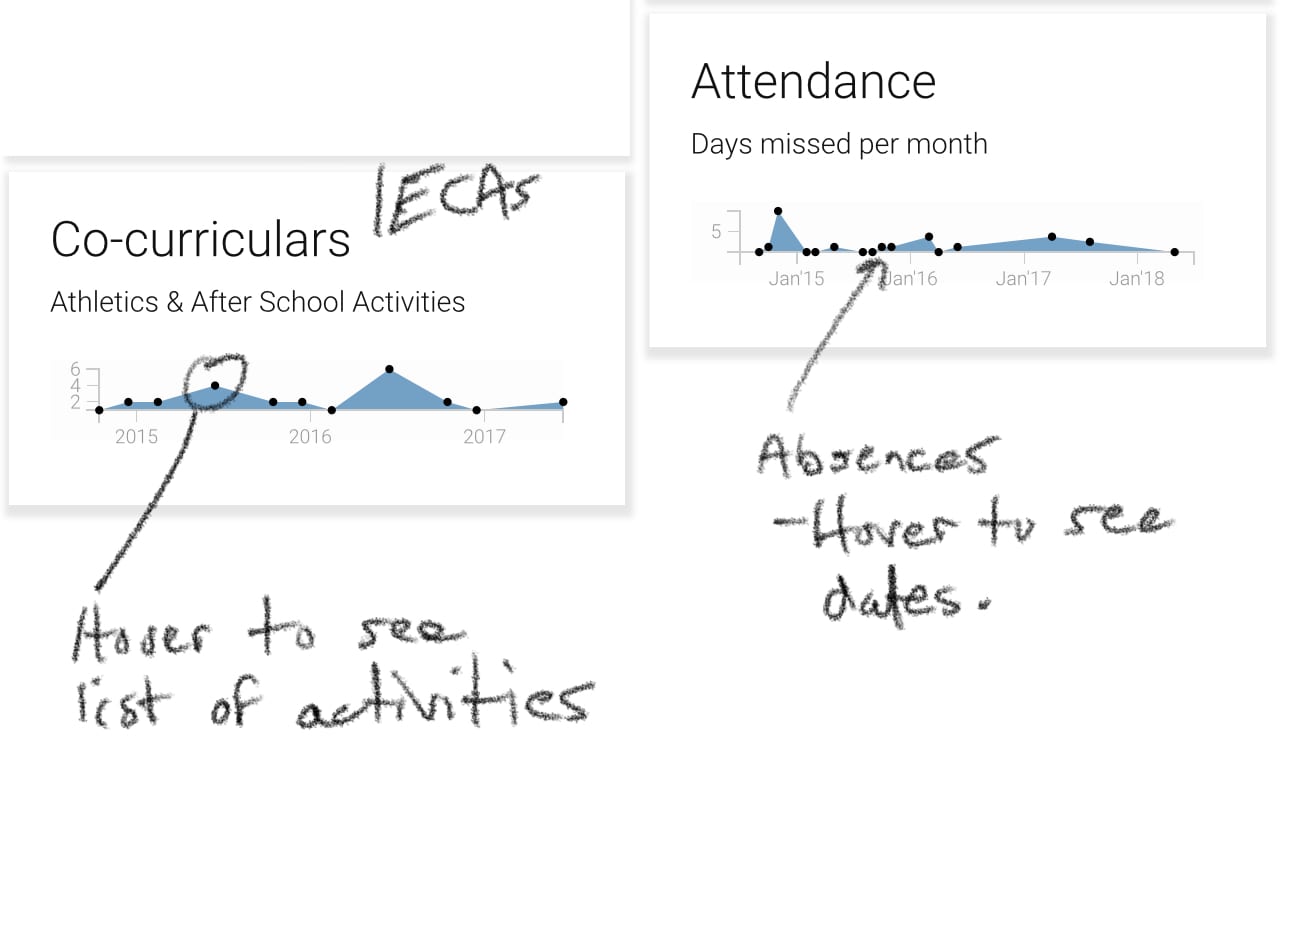
Attendance and ECAs
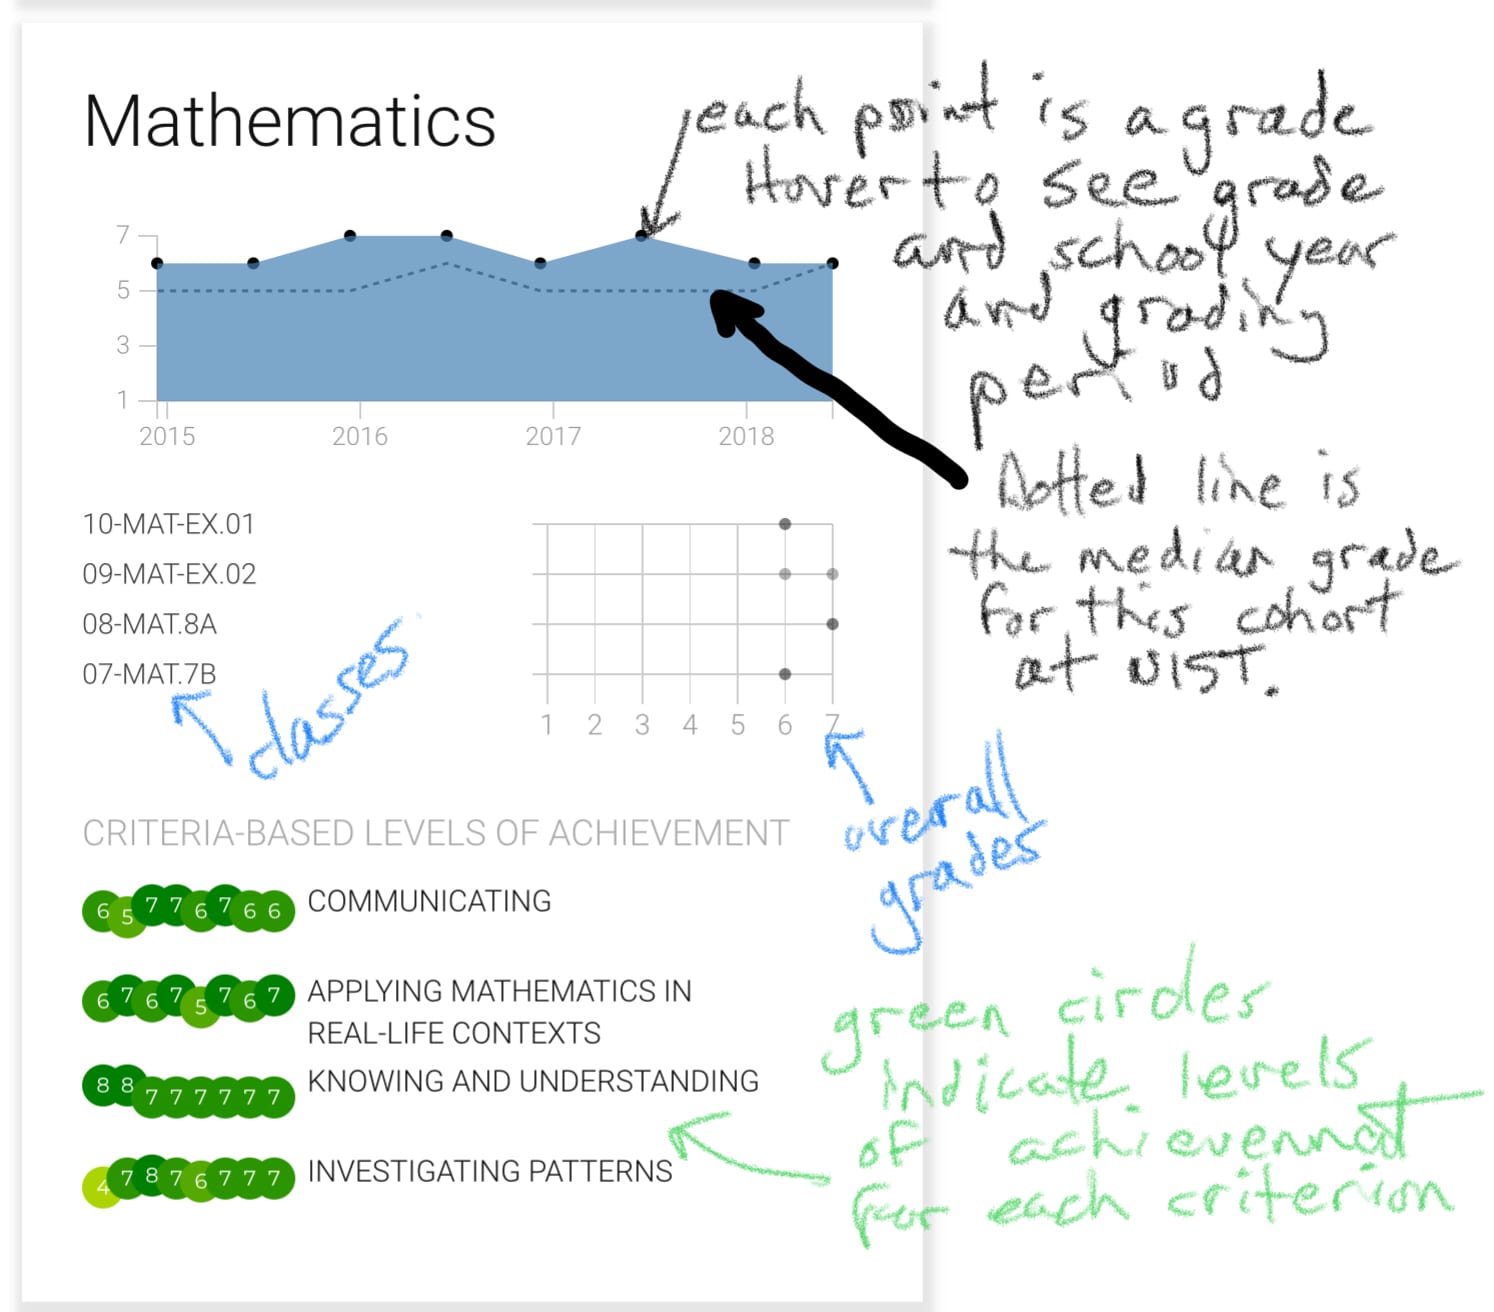
MYP Levels of Achievement and Overall Grades
Sections of the System
There are many engines in the LAC system.
| Engines | Description |
|---|---|
| Student Data Explorer | Find links to student ‘baseball cards’. View whole cohorts with color codes for Support Services. View assessment results for cohorts sorted in order. Useful to spot outliers. 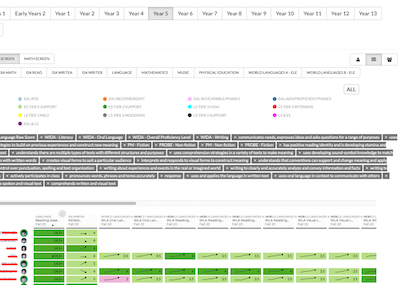 Student Data Explorer Video Guide The range is calculated based on all the scores of all students of each test type (column). If the score of the student falls in any of these ranges, then a color is assigned to that score based on the respective range. For example, consider scores for a test type ranging from 0 to 100, where 0 is the minimum score and 100 is the maximum score for all the data displayed. A score will have a color assigned according to this: 0-24 then Strong Pink 25-49 = Soft Pink 50-89 = Light Green 90 and above = Dark Green no data = White |
| ACER International Schools’ Assessment | View summary data for the ISA results. Useful to see students in order of performance on ISA test. View longitudinal data for NIST and other schools over time. View student performance over time grouped by scores at each semester. Useful to spot outliers. Click here to view the LAC ISA Engine Tutorial. 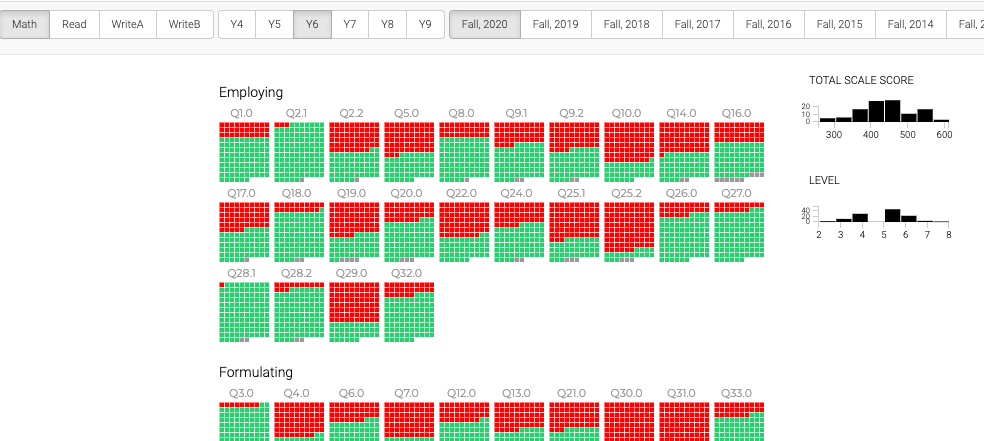 |
| IB Diploma Program 2010 to 2020 | View IB DP final exam and predicted grade results over time. Useful for teams to analyze their predictions and student performance over time. 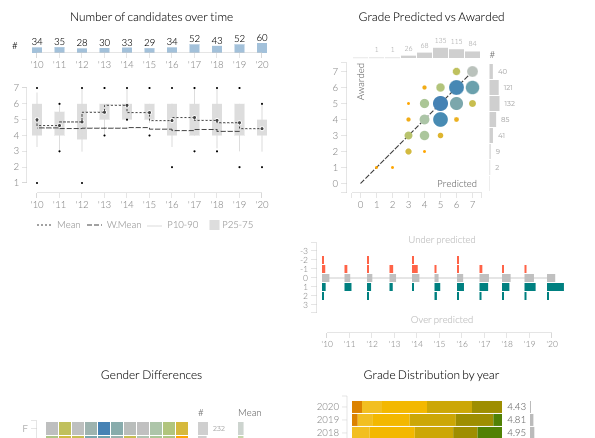 |
| Standardised Assessments NWEA MAP Scores | This is no longer applicable at NIST as we do not use the MAP assessment. |
| Standards Based Grades | View student performance over time grouped by scores at each semester. Useful to spot outliers.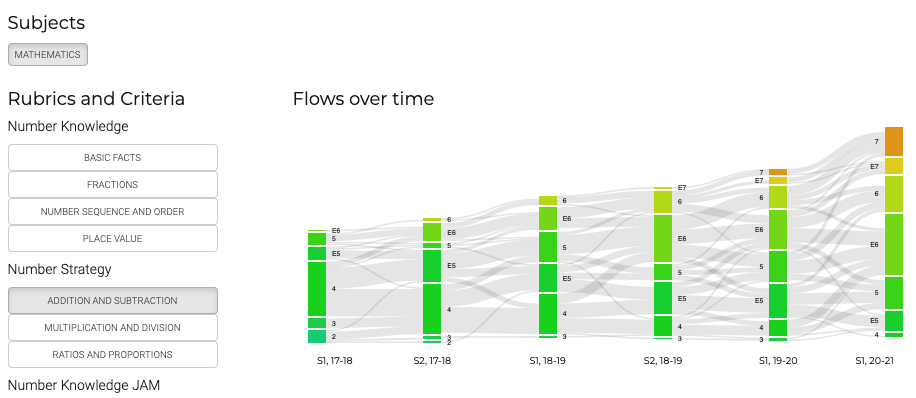 Standards Based Grades Video Guide |
| Grade Distribution MS & HS Academic Grades, 2014-14 to 2020-21 | This allows you to see the performance of cohorts over time. |
| Cross Correlations & Learning Clusters MAP, ISA, SBG, Academic Grades, LoA | Related assessments can be viewed on a scatter plot to see if there is correlation between any two factors. |
| Faculty Directory | This is a list of all faculty at NIST. This is no longer applicable at NIST. Use Veracross instead. |
| Class Placements | The Class Placement Engine is a set of tools that utilize student profile data to support teachers with the process of class placements and the analysis of class/cohort compositions and distributions. |